Curency Market
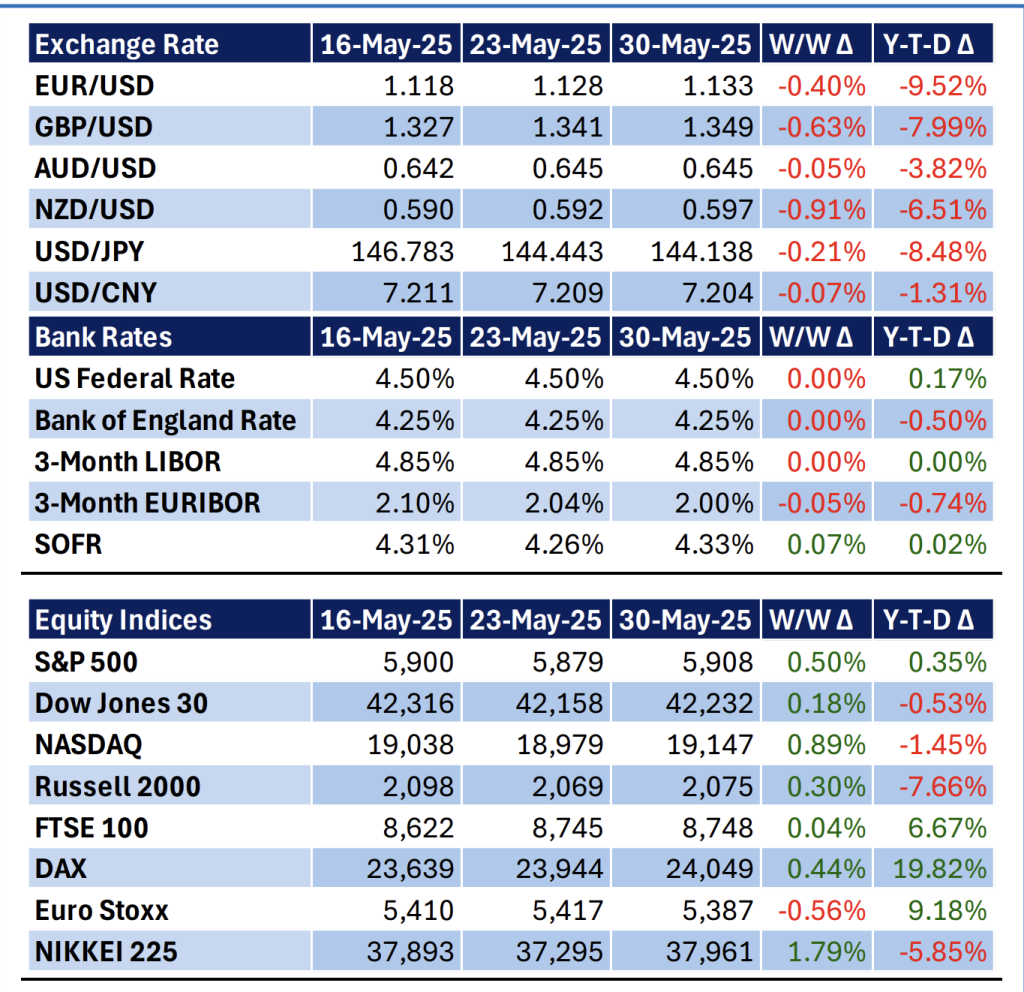
Last week, the US Dollar (USD) weakened marginally. It lost against the Euro (€), the Sterling Pound (£), the Australian Dollar (AUD), and the New Zealand Dollar (NZD) by 40 bps, 63 bps, 5 bps, and 91 bpsto exchange at 1.133, 1.349, 0.645, and 0.597, respectively. It also lost to its counterparts, the Japanese Yen (JPY) and the Chinese Yuan (CNY), by 21 bps and 7 bps, respectively, exchanging at 144.138 and 7.204, respectively. Overall, the dollar performance was mainly attributed to the earlier announced 50% tariff by the U.S. administration on the E.U. and the continued shift of investor sentiment. For the bank rates, major central bank policies remain unchanged. For the other major rates, the 3-month EURIBOR declined marginally by 5 bps to close at 2%, whereas the SOFR marginally gained by 7 bps to close at 4.33%.
Equities Market
Last week, most of the global indices experienced an improvement on average due to positive investor optimism. The S&P 500 index (^GSPC) was up by 50 bps to 5,908, the Dow Jones 30 index (^DJI) was up by 18 bps to 42,232, NASDAQ index (^IXIC) was up by 89 bps to 19,147, the Russell 2000 index (^RUT) was up by 30 bps to 2,075, the FTSE 100 index (^FTSE) was up by 4 bps to 8,748, the DAX index (^GDAXI) was up by 44 bps to 24,049, the Euro Stoxx index (^STOXX50E) was down by 56 bps to 5,387, and the NIKKEI 225 index (^N225) was up by 179 bps to 37,961.
Fixed Income Market
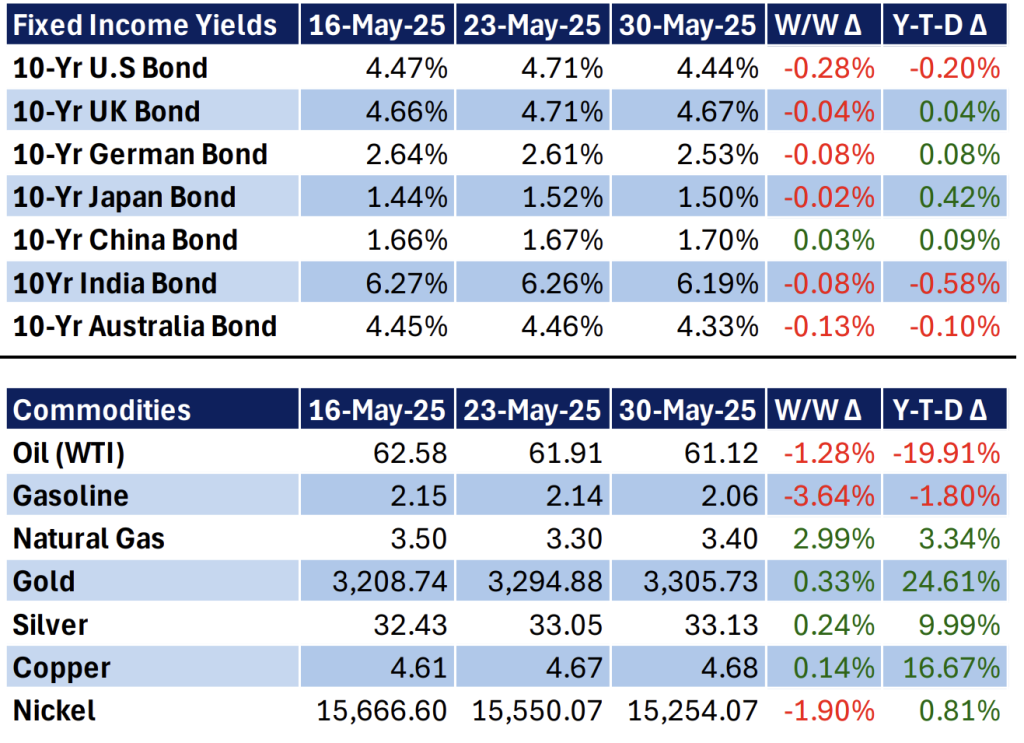
The fixed-income market experienced a declining performance, though at a marginal pace. The 10-year U.S, U.K, German, Japan, India, and Australia bonds declined by 28 bps, 4 bps, 8 bps, 2 bps, 8 bps, and 13 bps to close the week with the following interest rates: 4.44%, 4.67%, 2.53%, 1.50%, 6.19%, and 4.33%, respectively. Only the 10-year Chinese bond improved by 3 bps to close with an interest rate of 1.70%, up from 1.67% the previous week.
Commodities Market
The commodities market experienced a mixed performance. For the energy sector, oil and gasoline declined by 128 bps and 364 bps to close at a price of $61.12 per barrel and $2.06 per gallon, respectively. However, natural gas prices improved by 299 bps to close at $3.40 per quoted cubic feet. For the metals, gold, silver, and copper improved by 33 bps, 24 bps, and 14 bps to close at a price of $3,305.73 per ounce, $33.13 per mille, and $4.68 per ounce, respectively. Nickel declined by 190 bps to close at $15,254.07 per pound. The entire commodities performance reflects the interplay between supply-demand dynamics, which highly influences investor sentiment.
IMPORTANT NOTES
Y-T-D Δ is the change between the value of the latest quoted date and the value of the first quoted day of the year W/W Δ is the change between the average value of the current week and the average value of the previous week The dated value is the average value of the week ending on the quoted date
Basis Points (bps): 1 bps = 0.01% i.e 1/100th of a percent
Top News
Macro-Economic Developments
1. IMF Raises UK Growth Forecast Amid Easing Trade Tensions
The International Monetary Fund (IMF) increased the UK’s 2025 GDP growth projection from 1.1% to 1.2%, citing a robust first-quarter performance and a recovering economy. This positive outlook was bolstered by US President Donald Trump’s decision to delay imposing 50% tariffs on EU imports until July 9, alleviating immediate trade war concerns. Consequently, stock markets responded positively, with the FTSE 100 reaching a two-month high and Germany’s DAX hitting a record peak.
2. EU Plans Stress Tests for Non-Bank Financial Institutions
EU regulators are preparing their first stress tests targeting non-bank financial entities such as hedge funds and private equity firms. This initiative reflects growing concerns over the systemic risks posed by these lightly regulated sectors, especially as credit provision has increasingly shifted away from traditional banks since the 2008 financial crisis. The stress tests aim to assess the broader financial system’s vulnerabilities during market crises.
Micro-Economic Developments
1. US Business Investment Sees Sharpest Decline in Six Months
U.S. business investment experienced its most significant drop in six months, primarily due to trade war disruptions. Core capital goods orders, excluding volatile sectors like transportation, fell by 1.3%, signaling potential economic slowdown. While total durable goods orders sank 6.3%, much of that decline resulted from fluctuations in Boeing plane contracts. The inconsistency in tariff policies has hampered companies’ ability to plan, invest, and hire effectively.
2. Australian Capital Expenditure Contracts Amid Economic Challenges
Australia’s private capital expenditure experienced its sharpest annual contraction since 2020, falling 0.1% in the March quarter and 0.5% over the year. Non-mining investment declined by 1.6%, contradicting hopes for a private sector-led economic recovery. Business leaders are increasingly critical of government policies they view as anti-business, citing high operational costs and policy uncertainty. Calls for stronger investment incentives and broader tax breaks on capital spending are growing louder.
Disclaimer
The information contained in this report is provided for general informational purposes only and does not constitute an offer, solicitation, or recommendation to buy or sell any security or engage in any investment strategy. The content of the Reports is based on sources believed to be reliable, but Moran Capital Management Limited does not guarantee the accuracy, completeness, or timeliness of the information. Investing involves risks, and past performance is not indicative of future results. The value of investments and the income derived from them can fluctuate, and investors may not get back the amount originally invested. Changes in market conditions may impact the performance of the investments discussed in the Reports. The Reports are not intended to provide legal, tax, or investment advice. Before making any investment decisions, clients and readers are strongly encouraged to consult with their financial advisors, legal professionals, and tax advisors to assess the suitability and potential implications of any investment. Moran Capital Management Limited and its affiliates, officers, directors, employees, or agents shall not be liable for any direct, indirect, incidental, special, or consequential damages arising out of or in any way connected with the use of the information presented in the Reports. The Reports may include forward-looking statements, projections, or opinions that are subject to change without notice. Moran Capital Management Limited does not undertake any obligation to update or revise any forward-looking statements contained in the Reports. These Reports are proprietary to Moran Capital Management Limited and may not be reproduced, distributed, or transmitted, in whole or in part, without the prior written consent of Moran Capital Management Limited. By accessing and reading the Reports, you acknowledge and agree to the terms of this disclaimer. If you do not agree with these terms, please refrain from using the Reports.
Email: research@morancapital.co.ke